Modern accounting dashboards turn scattered transactions into a clear story your team can trust.
Most businesses do not fail because they lack sales—they fail because nobody can see, in one place, what money did, where it went, and whether the books still balance. A General Ledger (دفتر الأستاذ العام) is that place: the canonical record of every financial movement, tied to accounts, dates, and references. When that ledger lives in a modern web app—not only in spreadsheets or paper—you get something stronger than convenience: auditability, speed, and confidence.
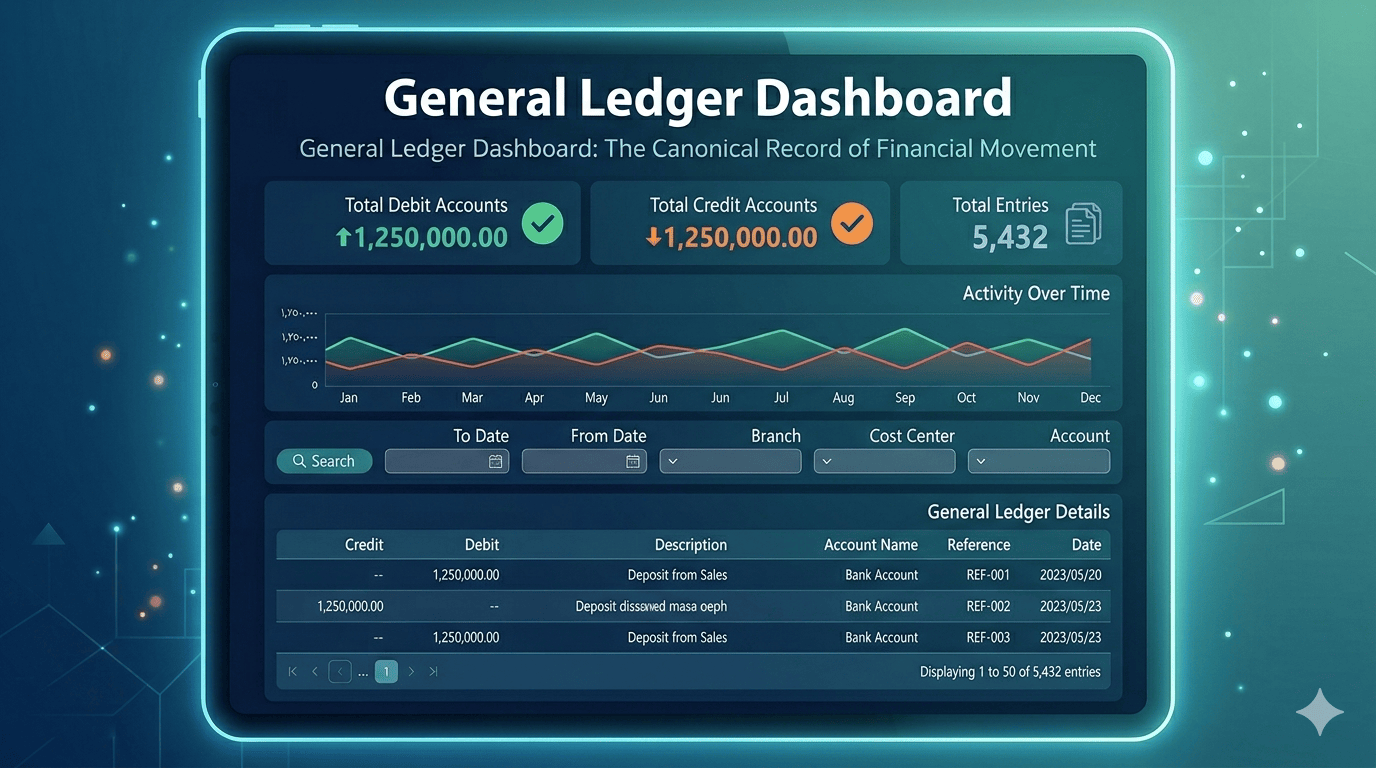
This post walks through what a well-designed general ledger screen actually gives you, using the kind of layout you’d expect in a serious ERP or financial module: summary metrics, trends, filters, and a detailed line-by-line journal.
What you’re looking at: more than a table
A strong general ledger view is built in layers:
1. At-a-glance health: debits, credits, and entry count
Top-level cards answer the first three questions an accountant or owner asks:
- Total debits and total credits should match in a double-entry system. Seeing them side by side (e.g., both showing the same total) is an instant sanity check that the period isn’t obviously broken.
- Total entries tells you how “busy” the period was—useful for spotting unusual volume (many small postings can mean automation, errors, or fraud patterns worth a second look).
These numbers are not decoration; they’re control totals before anyone drills into rows.
2. Activity over time: the chart as a narrative
A time-series chart (e.g., debits vs. credits by day across a month) turns raw postings into a story: seasonality, mid-month spikes, quiet ends of month, or sudden jumps that don’t match operations. Green and red lines for credit and debit activity make it easy to see whether movement stays aligned—when they diverge meaningfully, that’s a signal to investigate, not panic.
3. Filters that match how finance actually works
Real work is never “show me everything.” It’s “show me this account, this cost center, this branch, this date range.” Dropdowns for dimensions like account, cost center, and branch, plus a clear from–to date range and a single Search action, mirror how audits and month-end close actually proceed: narrow the universe, then read the detail.
4. The journal itself: the audit trail
The table is where trust is won or lost. Typical columns—date, reference (e.g., a sale or document id), account name, description, debit, credit—let you trace every line back to a business event. References like SALE-20230531-0001 tie accounting to operations: you’re not just seeing “money moved,” you’re seeing why.
Pagination (e.g., “1 to 50 of 70 entries”) keeps the UI fast while still exposing the full population when needed.
Why this matters for owners, accountants, and controllers
The underlying promise is simple: one source of truth for financial activity—easier reporting, fewer reconciling items, and a shorter path from question to answer.
Digital general ledger vs. “we’ll fix it in Excel”
Spreadsheets are flexible; they are also fragile. A proper ledger in an ERP or POS-linked accounting stack:
- Preserves double-entry rules and referential links (reference → document → lines).
- Scales with transaction volume without copy-paste errors.
- Supports roles (who can post, who can only view) in a way shared files rarely do well.
That doesn’t mean every small shop needs a full ERP on day one—but it does mean that as volume and scrutiny grow, centralizing the ledger stops being optional.